A typical shop floor, measured
0.0%utilisation
Two sensors round the power cables tell you what every machine actually did. No PLC access, no IT project, any age, any brand.
Put it on the three you reckon are busiest and find out what they actually did. Free if you go ahead afterwards, £250 if you don't.
Running, idle or stopped, with the reason where there is one. You see a stopped press before the morning meeting rather than after it.
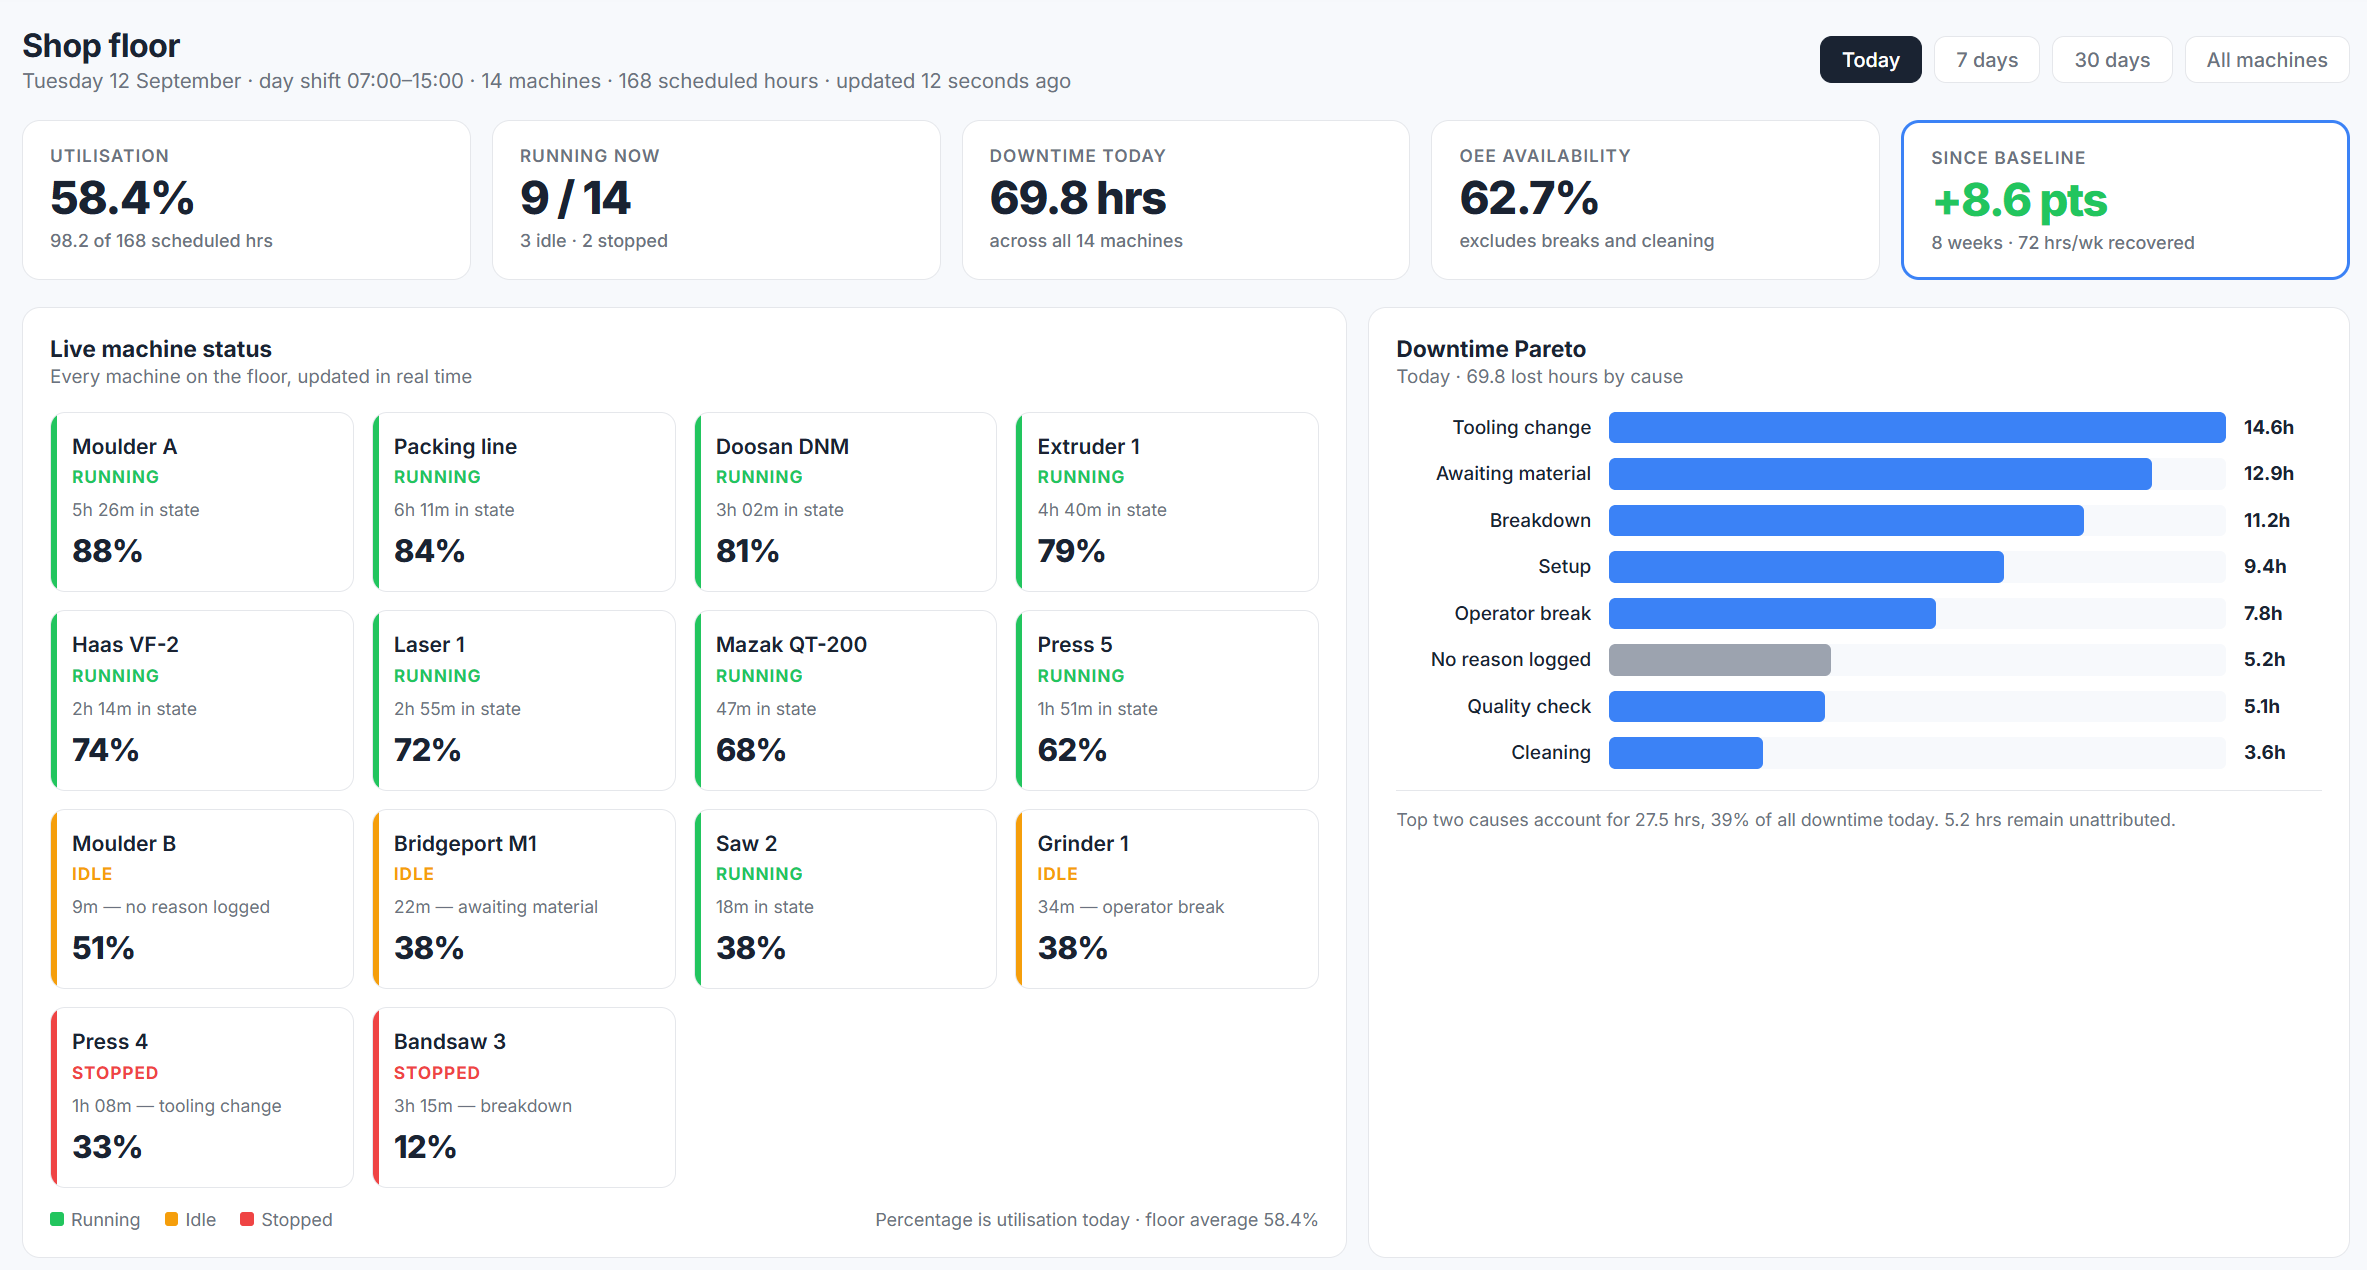
Fourteen machines. Nine running, three idle, two stopped. Bandsaw 3 has been down three hours fifteen with a breakdown.
Measurement on its own changes nothing. These are the three views that turn a number into a decision.
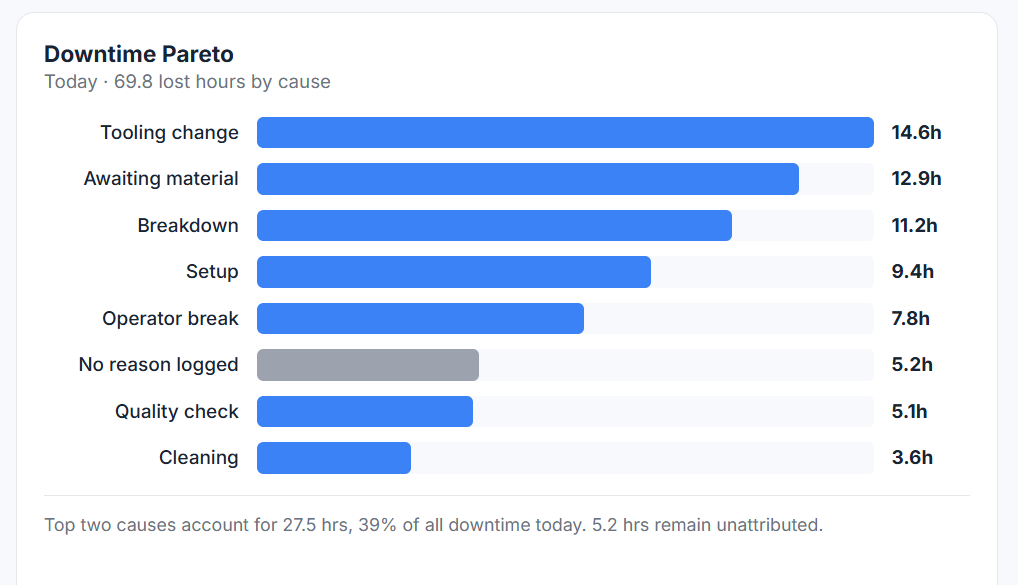
Lost hours ranked by cause. This is the chart that decides what you fix first, and it rarely says what anyone expected. Note the unattributed row — it tells you what it doesn't know rather than quietly rounding it away.
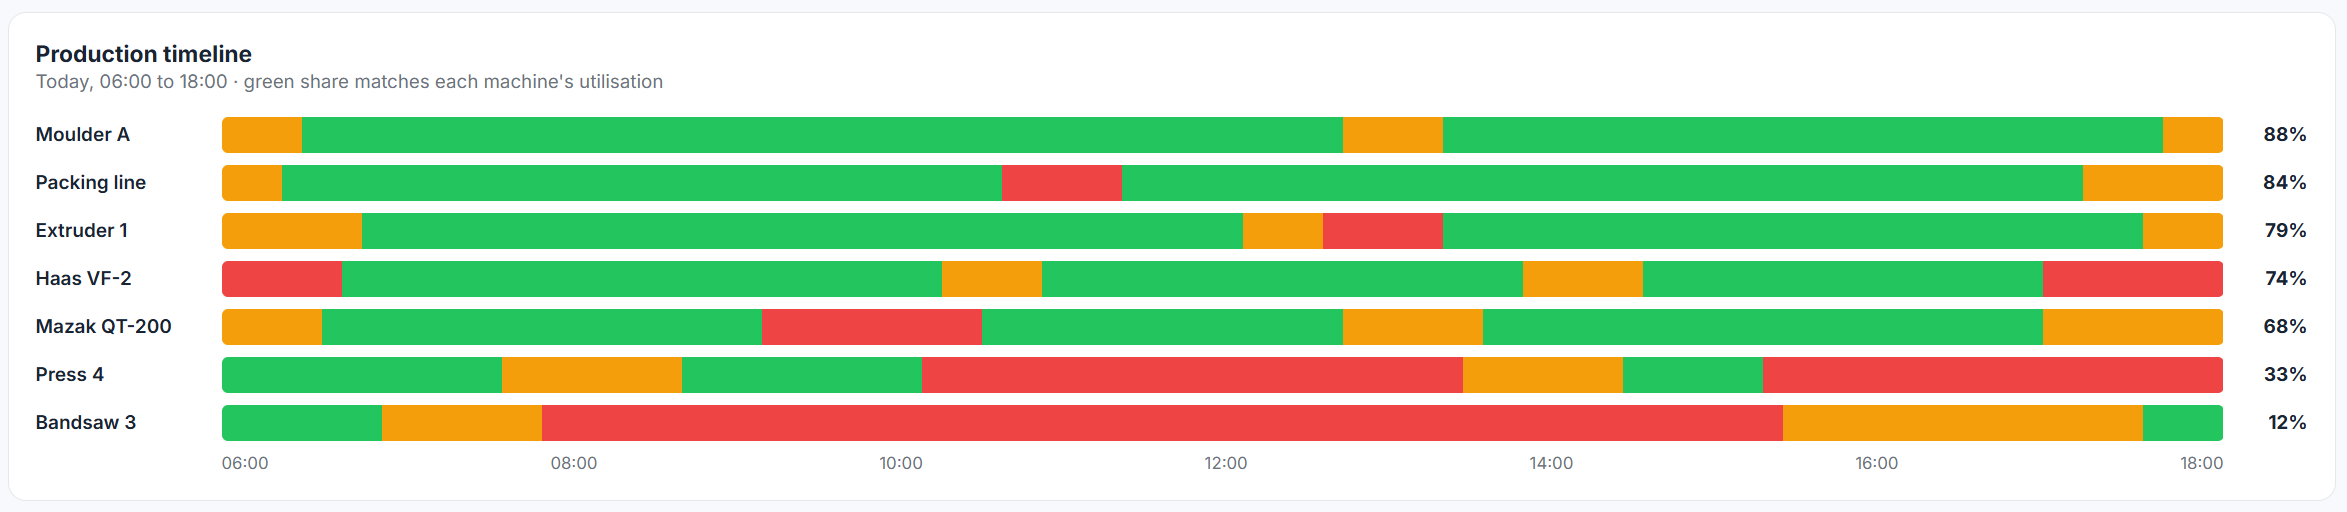
A bad day as a strip of states rather than a story reconstructed the next morning. The pattern is usually obvious once it's laid out end to end.
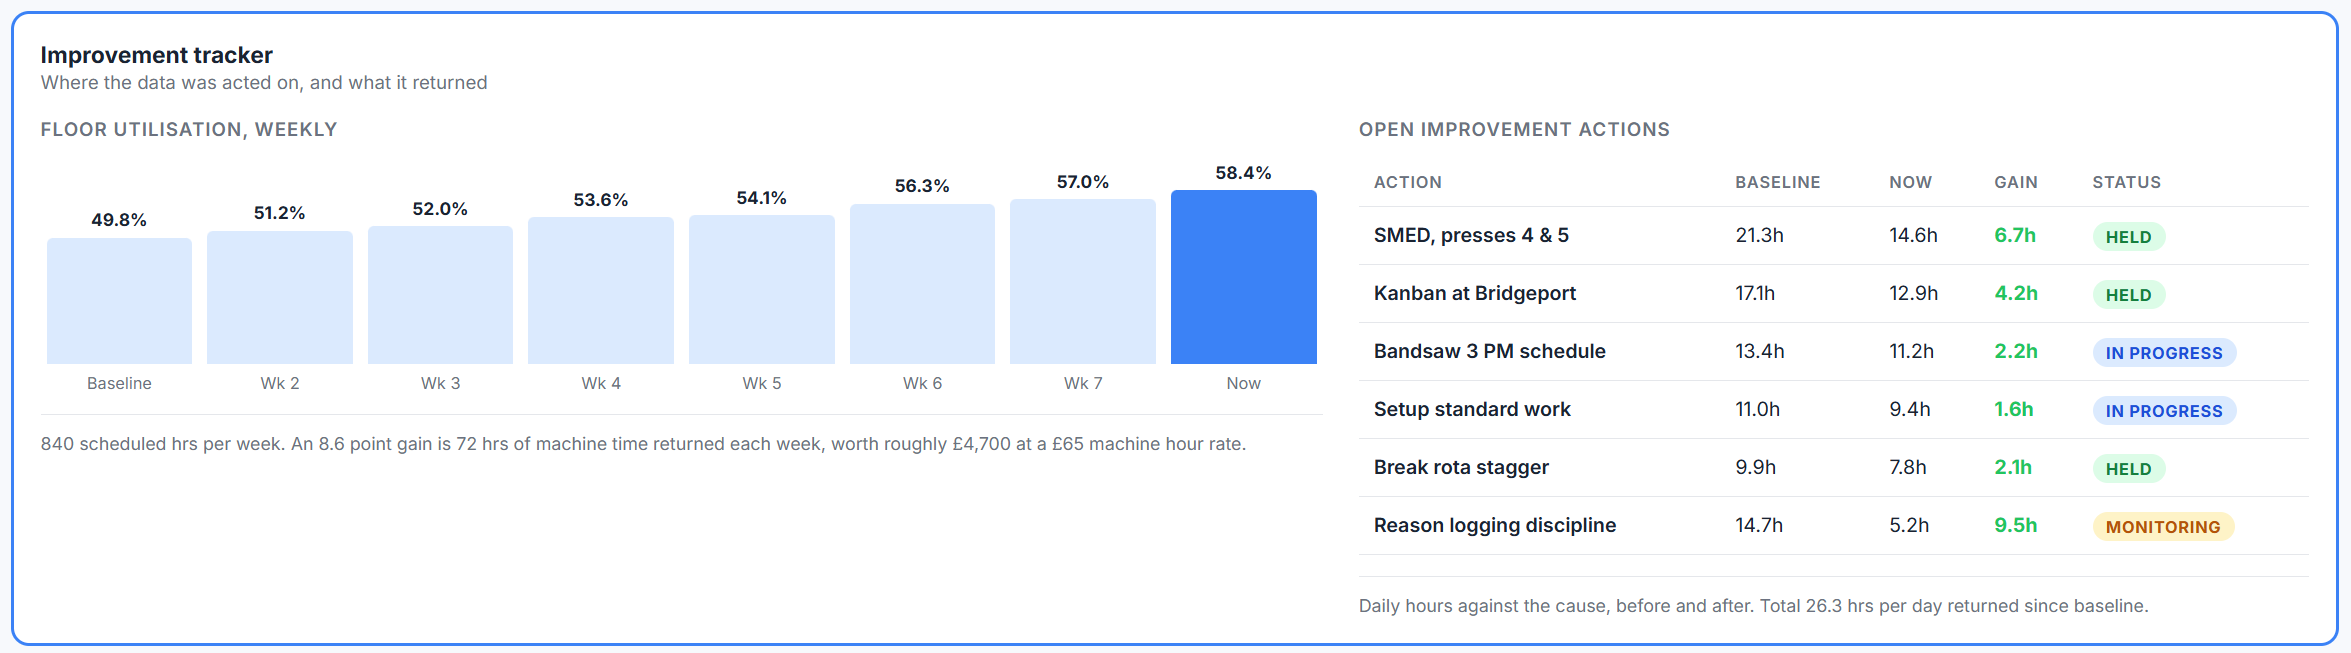
Every improvement tracked against the downtime cause it targeted, with the hours it gave back. Most monitoring stops at the chart. Measuring the fix is the part that pays for the system.
Your own electrician fits the sensors. Nothing is cut, nothing is rewired, and the controller is never touched.
Split-core clamps go round the existing cables, one on the incomer and one on the main drive. That's how a machine warming up gets told apart from one actually cutting.
DIN rail inside the cabinet, or a small enclosure beside it. All it needs is power and a network connection. Nothing wires into the controller.
Live status the same day. We calibrate thresholds on your machines, because every one has its own current signature. Give it a fortnight before reading much into it.
Current draw is current draw. Because we read the power signal rather than the controller, age and brand stop mattering. A 1980s lathe is often the best candidate on the floor.
Clamp sensing, controller integration, stack light sensors, manual logging. What each can tell you, what it can't, and what to ask any supplier before you commit. We build one of the four and we've said so.
The machines will tell you a job stalled at ten past two. They can't tell you the fixture was still on the other side of the shop. Senloq also tracks the tooling, trolleys, stillages and trucks moving round the floor, so an idle machine gets matched to the material that hadn't arrived.
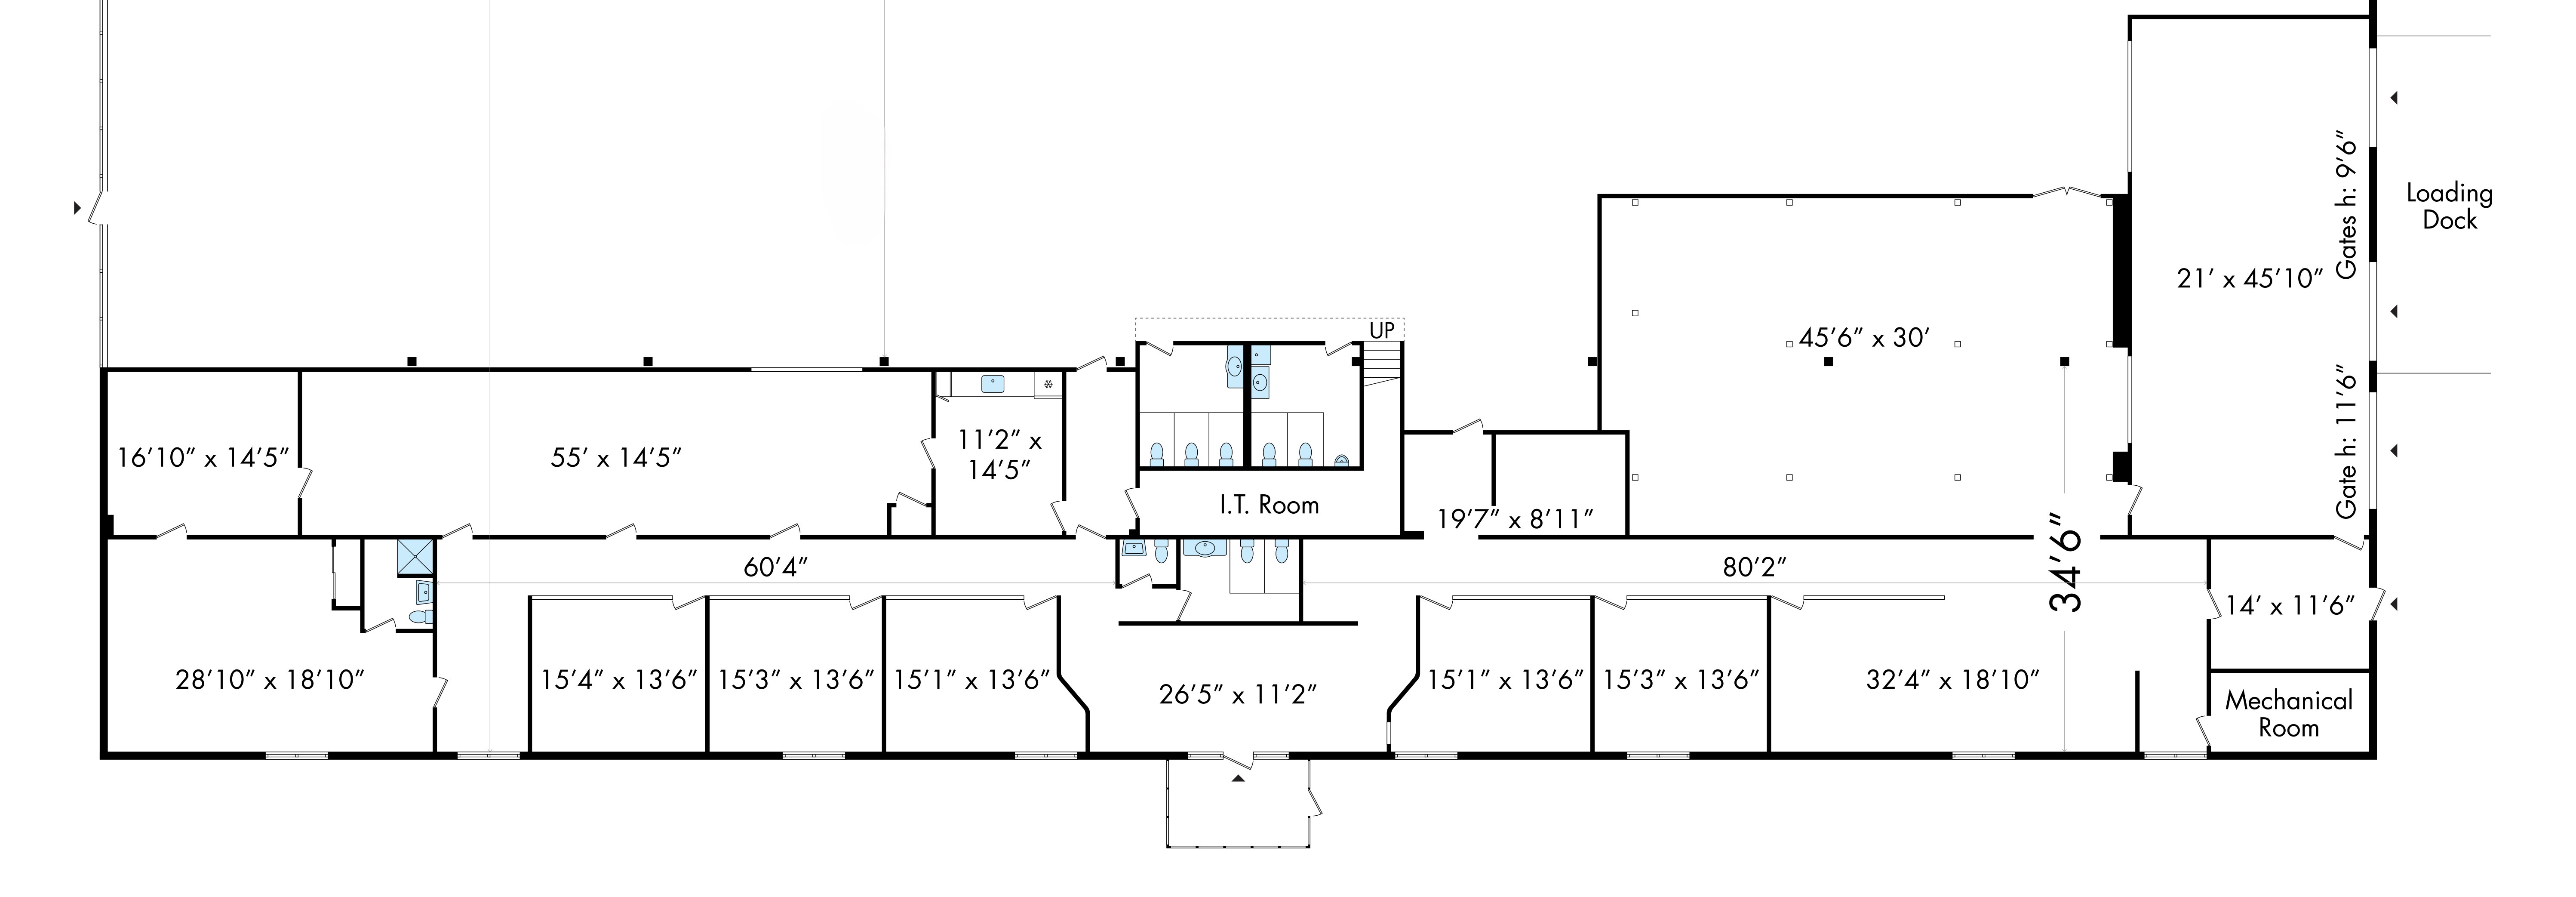
Search any jig or gauge and see where it is now. Stops you replacing kit that was never lost.
Follow every batch through production. Spot a stall while it's happening, not at the end of the week.
See where the forklifts are working and keep live counts of crates and stillages by area.
Travel paths, dwell and cycle times mapped. Spaghetti diagrams filled in automatically.
Room-level coverage where knowing the area is enough.
Angle-of-arrival and UWB anchors placing each asset live on your floor plan.
Same tags, same dashboard, so no rip-and-replace moving between them. Most shops start with the machines and add this once the first numbers land. More on asset tracking
Fifteen minutes on the phone. We'll tell you straight whether it's worth doing on your shop, and if it isn't, we'll say so.
Book a 15-minute callWe use cookies that make the site work, and we'd like to use Google Analytics to count page views. Analytics only runs if you say yes. Details in the cookie policy.