Two current sensors clip round the power cables on each machine. From that we work out when it was cutting, when it was powered up doing nothing, and when it was off. No PLC access, no rewiring, no IT project, and nothing that stops working because a machine is thirty years old.
Almost everything else on this page follows from one decision: reading the power signal rather than talking to the controller.
A single clamp on the incomer only tells you whether the machine has power. That counts a machine warming up, or sat in a fixture change with the hydraulics running, as production. So a second clamp goes on the main drive. The difference between the two is what separates powered-on from actually working.
Both are split-core, which means they clip around the existing cable. Nothing is cut, nothing is spliced, and the cable stays exactly where it is.
Every machine draws a different current signature, and the same model running different work draws differently again. We set the thresholds on your machines rather than shipping a guess and hoping. That's an afternoon during commissioning, and it's the difference between a number you trust and a number you argue with.
| Sensor | Split-core current transformer, clipped round the existing cable |
|---|---|
| Per machine | Two: one on the power incomer, one on the main drive |
| Edge unit | Arduino Opta, DIN rail mounted, CE and UKCA marked |
| Needs | Power and a network connection. Nothing else. |
| Controller access | None. Nothing connects to the PLC or CNC control. |
| Install time | Around ten minutes a machine, by your own electrician |
| Optional inputs | Spare inputs for a proximity switch or photo-eye where you want a true part count |
| Hosting | AWS, Ireland. Your data stays in the EU. |
Most shops measure the first and third and quietly count the second as production. That's where the missing hours live.
Drive current above the threshold we set for that machine. This is the only state that counts as productive time.
Machine is on but the spindle isn't loaded. Setups, first-off inspection, waiting on material, waiting on an operator, or simply left running through a break.
No power draw. Breakdowns, planned maintenance, or nobody on that machine this shift.
If a stop lasts longer than the threshold, the operator gets a prompt to tap a reason. One tap, not a form. The utilisation number is right whether they bother or not; the reason codes are what turn it into a Pareto worth acting on.
Four views, on a desk, a phone, or a screen hung on the shop floor.
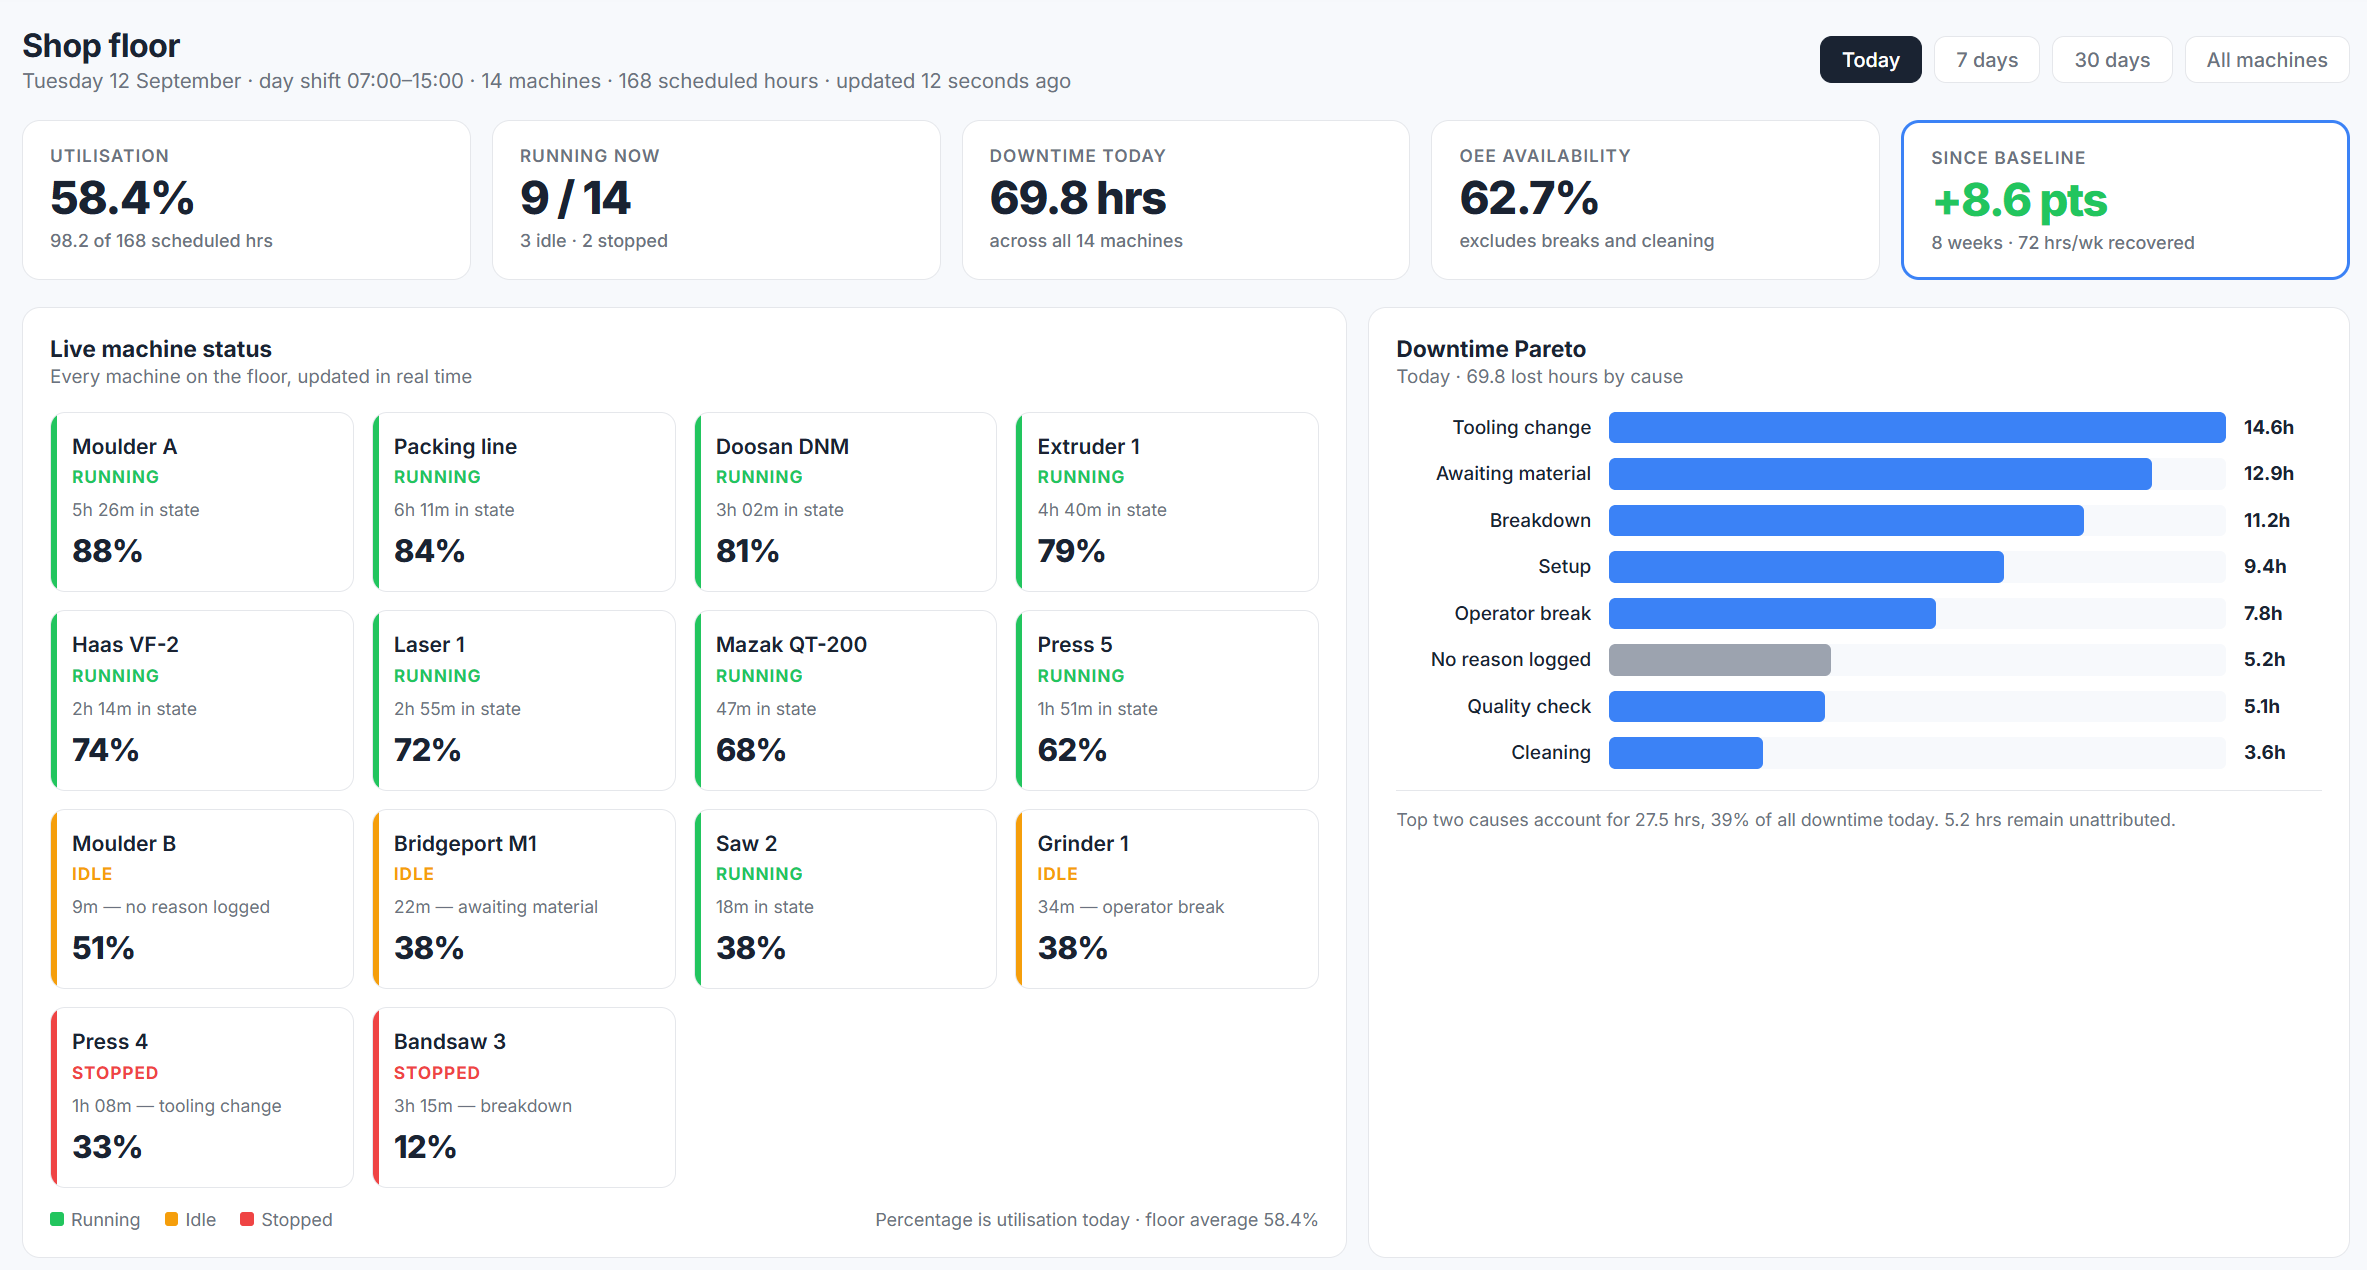
Live status. Every machine, its current state, how long it's been in it, and the reason where one was logged.
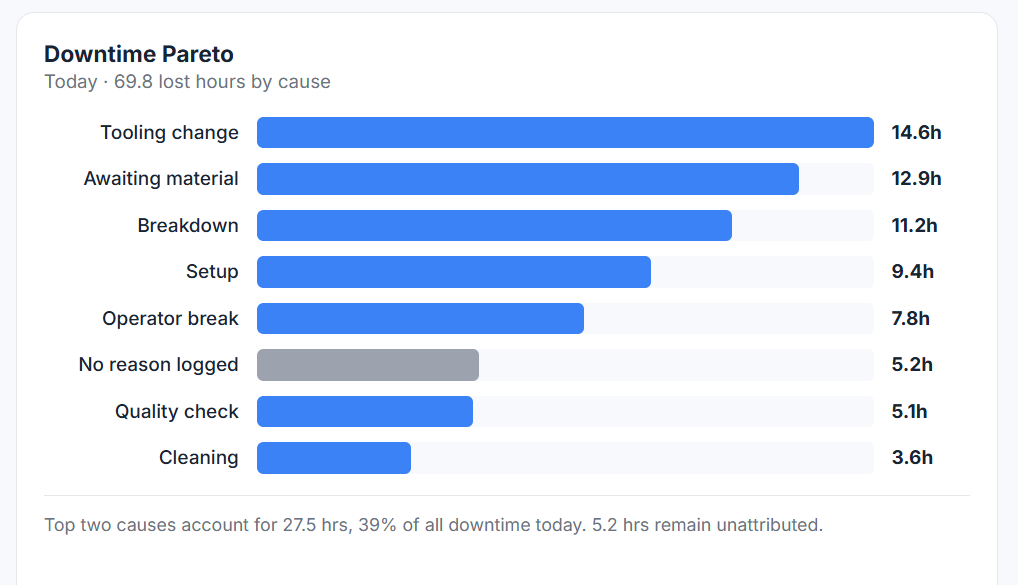
Lost hours ranked by cause, so the argument about what to fix first has an answer. The unattributed row is deliberate: it shows you how much you don't know, rather than folding it into something that looks tidier.
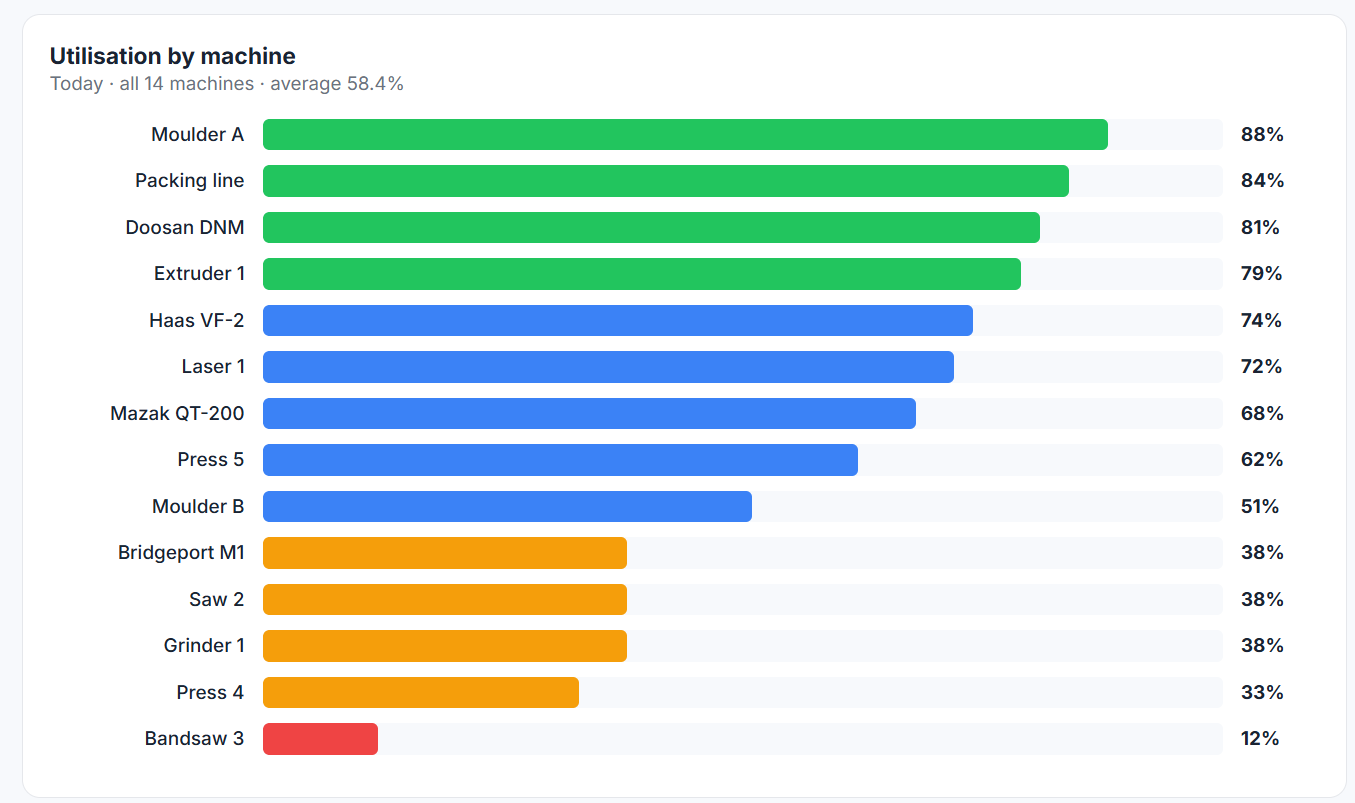
The whole floor ranked. This is the view that shows you the spread — the machines you worry about are often fine, and the quiet one in the corner is the problem.
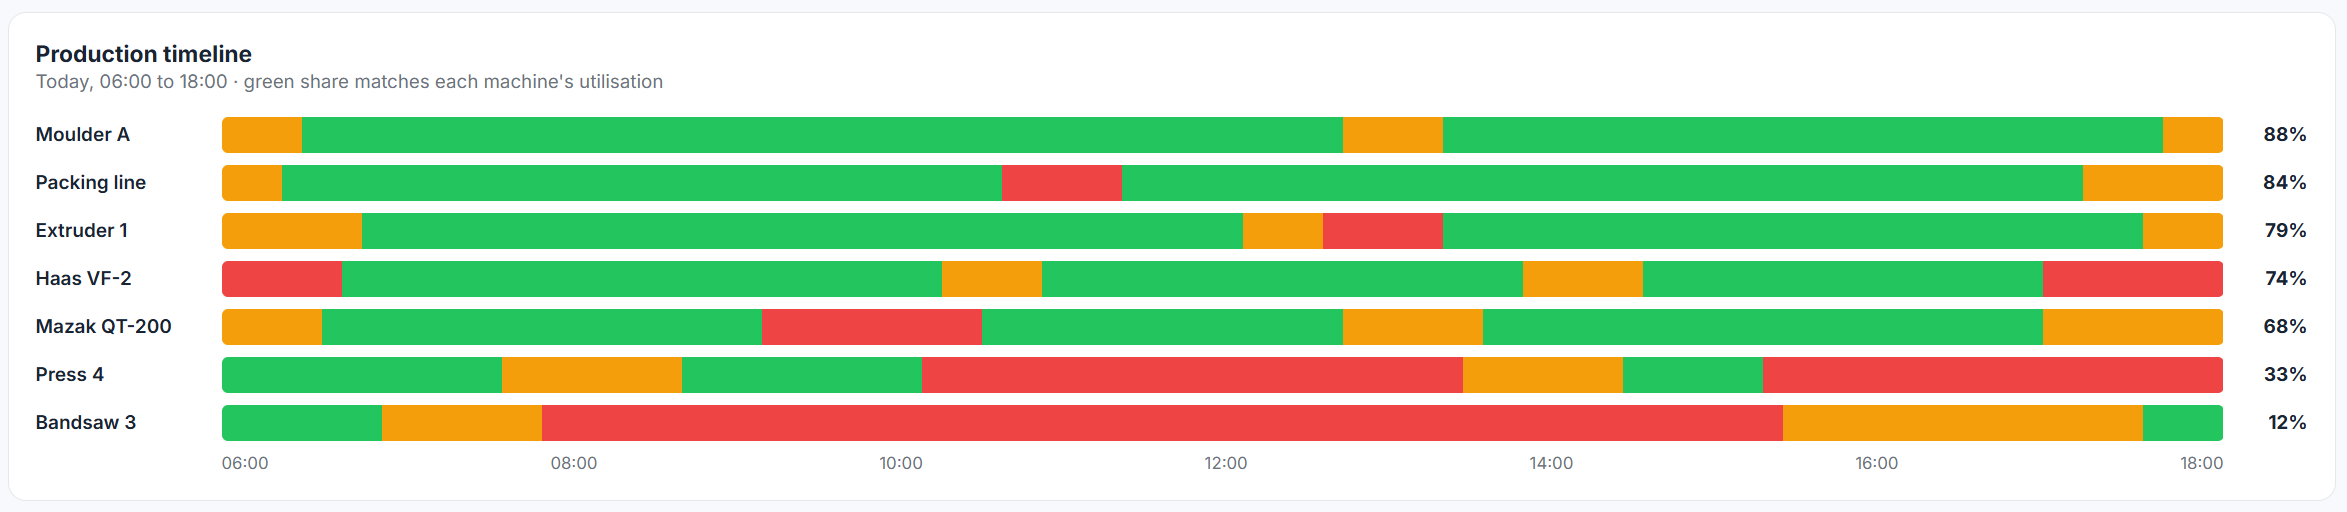
The shift replayed as a strip of states. Patterns that are invisible in a daily average are obvious here: the machine that never starts before eight, the gap that appears every Friday afternoon.
Every monitoring system gives you a Pareto. Almost none of them show whether the fix worked. Each action is tracked against the cause it targeted, with the hours it gave back and whether the gain held or quietly slipped.
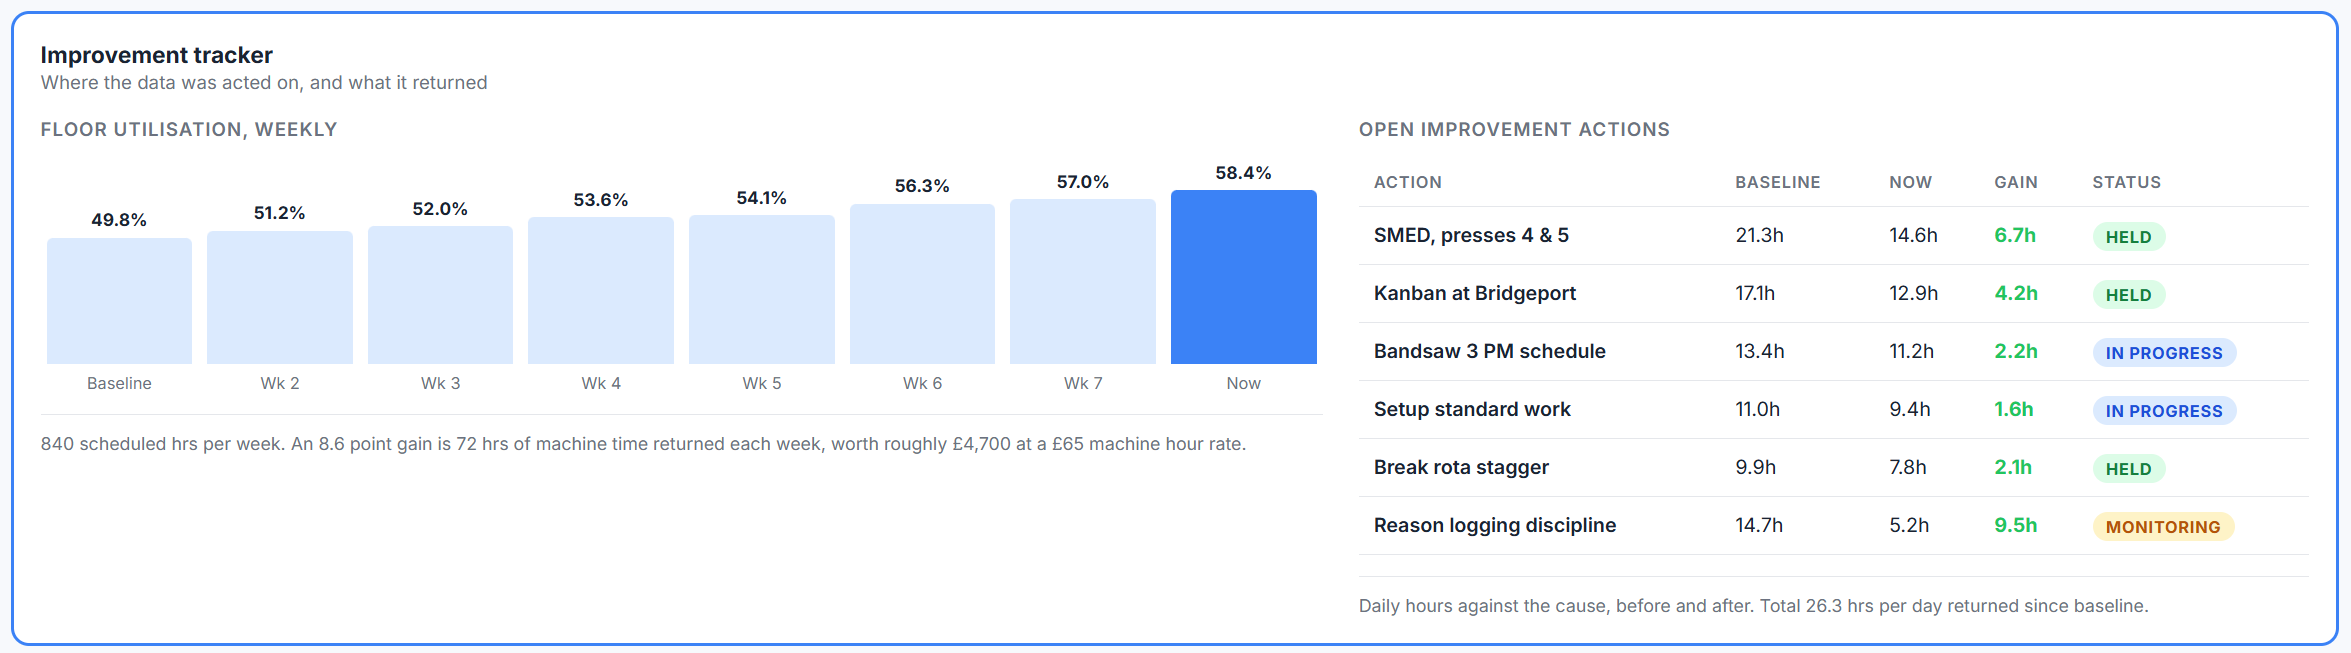
Worth knowing before you spend anything, rather than after.
Find out what the floor actually does before you build a business case, not after. Free if you go ahead afterwards, £250 if you don't.
We walk the floor and agree which three machines to instrument. Pick the ones you reckon are busiest.
Your electrician fits the sensors. We commission the units and set the thresholds on your machines.
Live dashboard from day one, with a check-in each week. Ignore the first fortnight; it takes that long to settle.
Your real utilisation figure and your downtime Pareto, and an honest view on whether doing the rest of the floor is worth it.
Fifteen minutes on the phone. We'll ask what machines you've got and tell you straight whether this is worth doing on your floor.
Book a 15-minute callWe use cookies that make the site work, and we'd like to use Google Analytics to count page views. Analytics only runs if you say yes. Details in the cookie policy.